

A total is only useful when you know what went into it. The Hallucination Tracker keeps the failure description, AI-involvement evidence and record type separate. This analysis shows why those distinctions matter when someone cites the collection.
What does the frozen release contain?
Tracker v2.23, released October 16, 2026, contains 113 records. Each stable ID counts once. The unit is a published record: a study with many trials still counts once, just as a court case with several source documents counts once. All figures below come from the frozen JSON, with the full calculation in the aggregate download.
| AI involvement | Hallucination | False claim | Total |
|---|---|---|---|
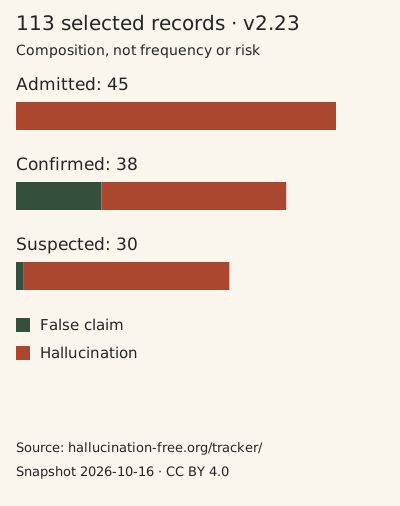
| Admitted | 45 | 0 | 45 |
| Confirmed | 26 | 12 | 38 |
| Suspected | 29 | 1 | 30 |
| Total | 100 | 13 | 113 |
The chart uses these same counts. Bar lengths represent the number of included records, not the likelihood that an AI system fails.
Why does AI involvement need its own label?
Thirty of the 113 records have suspected AI involvement: 30 ÷ 113, or 26.5% of this release. Calling all 113 “confirmed AI-generated incidents” would discard a material qualification. In suspected cases, the record attributes the inference and its basis; it does not establish that a named person used AI.
The other labels answer different evidence questions. Admitted means responsible parties acknowledged use. Confirmed means the documented output or an institutional finding establishes AI involvement within the stated scope. Neither label, by itself, proves a particular technical cause, intentional deception or legal liability. Those questions remain in the individual source account. See the classification method.
The zero in the admitted/false-claim cell means this release contains no record with that combination of labels. It says nothing about whether that combination occurs outside this collection.
Are all 113 records the same kind of event?
No. The second classification supplies a different denominator choice:
| Record type | Count |
|---|---|
| Documented incident | 93 |
| Controlled study | 13 |
| Evaluation with external action | 1 |
| First-person report | 4 |
| Reported allegation | 2 |
| Total | 113 |
Thirteen studies make up 11.5% of the release (13 ÷ 113). Their output findings do not establish customer losses. The evaluation with an external action is separate because an evaluation setting can still affect a real destination. First-person reports and allegations retain their limits; inclusion is not independent confirmation of every reported consequence.
Can these counts show that hallucinations are getting worse?
This collection has no denominator of all AI requests, users or deployments, and its historical coverage changes as sources are recovered. It therefore cannot estimate a hallucination rate or establish a time trend. A later release adding an older case changes the archive, not the date of the event.
A benchmark uses a different unit and sampling process. For example, FActScore’s abstract describes the share of atomic facts supported by a knowledge source in generated biographies. That is not comparable to a count of selected incident records. Use the measurement guide to define an evaluation denominator.
The AI Incident Database editor’s guide also distinguishes an event from reports about it. Its inclusion policy differs from ours; totals from different registries should not be added without reviewing scope and duplicate events.
How can you reproduce and cite this analysis?
Download the Python script and frozen JSON into one folder. With Python 3.9 or later, run:
python3 reproduce.py hallucination-tracker-v2.23.json tracker-analysis
The script makes no network requests. It verifies the snapshot hash, checks ID uniqueness, counts every label combination including zeros, and writes summary.json, counts.csv and chart.svg. Every percentage in the CSV uses 113 records as its denominator; percentages are rounded to two decimals there and one decimal in this article. Exact counts are authoritative.
Published outputs: JSON · CSV · chart. The snapshot’s SHA-256 is 9e6881b9d74f44c7a1c9ee0b976200e4555c9e65e9999159212e80b1003acdb8.
How to cite Hallucination-Free. What 113 Tracker records can—and cannot—tell you. October 16, 2026. Analysis of Tracker v2.23. Link this article and the frozen release; include your access date. Original analysis, chart and calculation script: CC BY 4.0; credit the publication and identify changes.
For the other failure categories, read the companion Register evidence analysis. To turn a selected case into an evaluation, use the incident-to-test worksheet.
Frequently asked questions
Are all Tracker records confirmed AI incidents?
No. Version 2.23 labels 38 confirmed, 45 admitted and 30 suspected for AI involvement. These labels are separate from record type and legal liability.
Can a growing incident count establish a rising failure rate?
No. This curated collection has neither a denominator of all AI uses nor consistent historical coverage; additions cannot establish a population trend.
The source record
Read the original evidence and the scope of our review.
- Hallucination Tracker v2.23Hallucination-Free · 2026-10-16 · Accessed 2026-10-16Reviewed the local canonical records and frozen export prepared for this release. The article provides the v2.23 snapshot and input hash.
- Editor's GuideAI Incident Database · Not stated in the reviewed text · Accessed 2026-10-16Indexed passages read with read_page, then full guide read with fetch_page; used for incident/report distinction, not as our inclusion standard.
- FActScore: Fine-grained Atomic Evaluation of Factual Precision in Long Form Text GenerationAssociation for Computational Linguistics · 2023-12 · Accessed 2026-10-16Abstract and bibliographic record read with fetch_page after read_page failed; full paper not read.